For you to be reading this, it surely would be no news that data visualization has become a very critical part of the IT world today. The huge amount of data being generated by different web technologies need to be properly refined and visualized for the world to use and gain insights from.
The advantages of understanding data are tremendous and it leads to taking well-informed decisions over time. The ability of an organization to get their data extracted, cleaned, visualized and analyzed could very much be the difference between profit or loss.
As a front-end web developer, it is a great skill set to be able to visualize data as much as you can make beautiful interactive web pages. These JavaScript libraries have made the task easier, as developers do not have to endure a change of language syntax to convert those magical numbers into understandable charts.
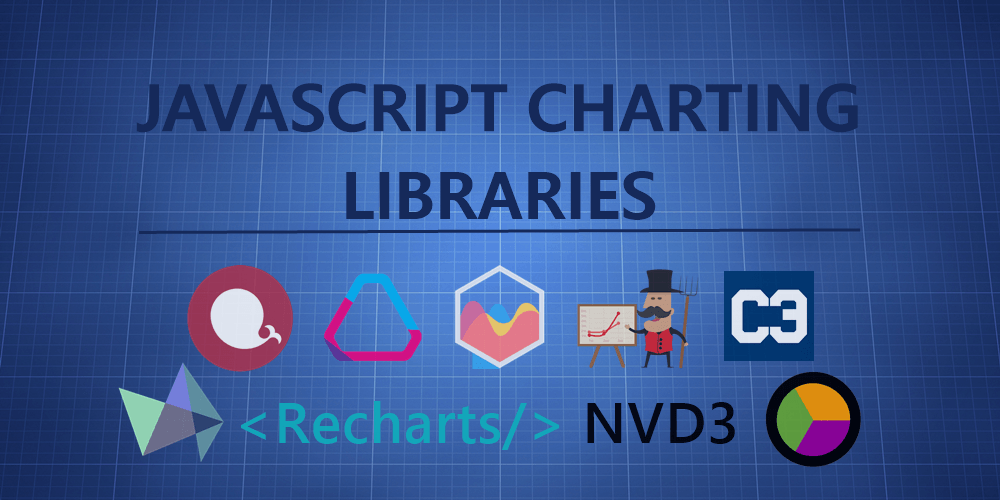
There are a lot of JavaScript libraries out there for this purpose. And that’s the reason why these nine have been picked out. They stand out from the rest, and would very much serve the needed purpose well. Before we proceed, here is a list libraries, I picked out:
- Echarts
- Tau Charts
- Chart.js
- Chartist
- C3.js
- Highcharts
- ReCharts
- Nvd3
- Flot
It is important to note, that this article is not a tutorial. However, links to each library have been added to make the job of learning easier.
ECHARTS
 What else can you get from a product created by Chinese big shots Baidu Inc. if not one with great quality?
Echarts is very useful for visualizing data on web pages. With it, you can create intuitive, customizable and interactive charts making interpretation and analysis of data easier.
A lot of JavaScript charting libraries out there have been ported to JavaScript, meaning their usage do not flow seamlessly. That is not the case with Echarts though, as it was written in plain JavaScript.
Documentation is available for this library on its official web page, and you don’t have to freak out about its status of being a Chinese library. It is very well documented in English.
Installing this library is easily done with npm:
npm install echarts -- saveTo learn more about this library, you can see from the official website and also check out the GitHub page.
Example - Large-scale scatterplot
TAU CHARTS
 TauCharts is one of the most flexible JavaScript charting libraries out there. It is also D3 based and is a data-focused JavaScript charting library that allows for improved data visualization.
Talking about its flexibility, TauCharts allows for easy access to their API. Giving users the opportunity to seamlessly map and visualize data to get more amazing insights.
It is not just flexible. It also renders the charts pretty fast and is easy to learn.
To install through npm, simply type in:
npm install tauchartsTo learn more about this you can check out the official website and also the learn from some tutorials on the npm page.
Example - Horizontal line
CHART.JS
Perfect words to describe the Chart JS library. The Chart JS library is an HTML5 based JavaScript library for creating animated, interactive and customizable charts and graphs.
With Chart JS, you can easily get to visualize your mixed chart types without hassle, creating responsive web pages by default.
This library allows you to get started with visualizing your data in quick time. Easy to set up, and beginner friendly. With it, you won’t have to get involved in browser compatibility issues, as it supports older browsers.
To install Chart JS using npm:
npm install chart.js -- saveProper documentation and some tutorials on this library exist on their official website and GitHub page.
Example - Radar
CHARTIST
 If you are looking to create beautiful, responsive, reader-friendly charts, Chartist is the library to utilize.
Chartist uses SVG to render charts. It also gives the functionality of customizing your charts using CSS media queries and creative animations. You can bring all of your creativity into your charts.
Chartist is notably easy to configure, as well as being easy to customize with Sass. It, however, doesn’t support older browsers like its “sister” Chart.js does.
You can imagine how much of perfection you can come up with, as you get to beautify your SVG by styling with CSS and creating all the lovely animations you desire.
This library can also be installed using npm:
npm install chartist -- saveThere is a lot of information on using this library on its official website.
Example - Pie chart with custom labels
C3.JS
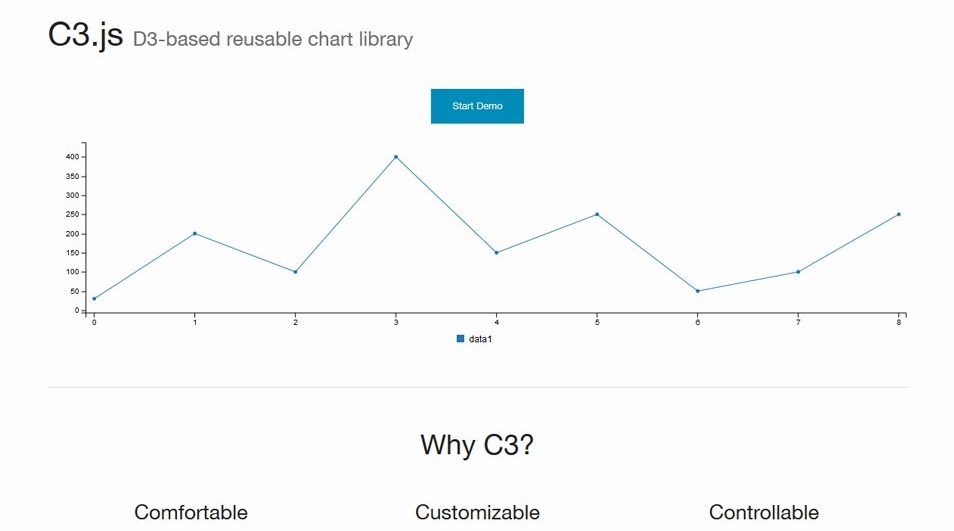 Just like TauCharts, C3 is another very efficient D3 based chart visualization library. As a plus, it allows you to create classes that can easily be customized to personal taste or style.
C3 on the surface looks like a difficult library to use. However, the moment you get a hold of its techniques, there is no stopping you.
With this charting library, you can update charts even after the first rendering by creating callbacks. It is easy to find your way around using this library, as it also reduces the work to be done by allowing you create reusable charts for your web applications.
To install the C3 chart library using npm:
npm install c3More on this library can be read up on from the official website and the GitHub page.
Example - Combination Chart
HIGHCHARTS
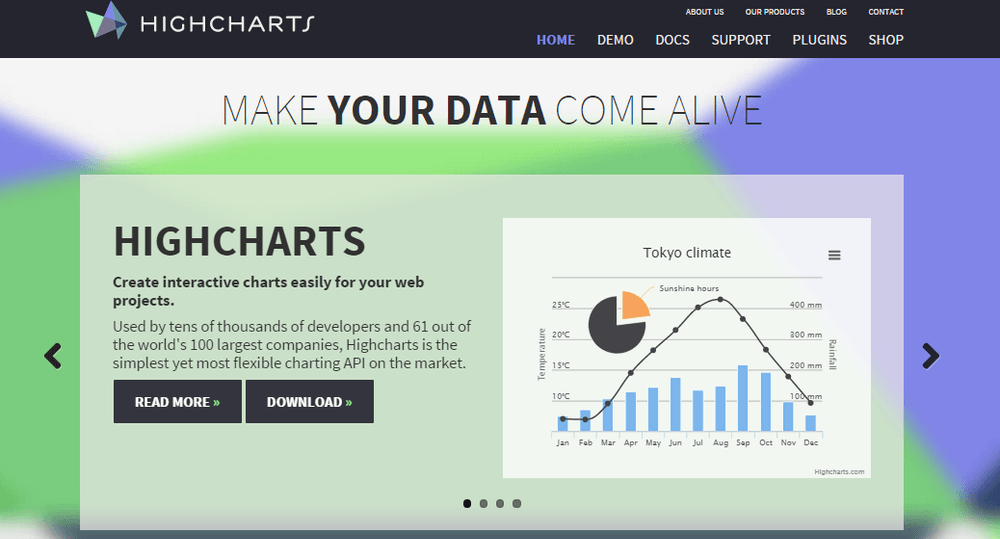 Bring your data to life with HighCharts.js.
With Highcharts, you can create interactive charts using pure JavaScript. It renders easily with SVG and works perfectly with HTML5 as you try to add interactive charts to your web applications.
It is very much lightweight, as it doesn’t require any plugin. This doesn’t make it any less efficient than the other charting libraries. You can create any chart you can think of, be it the column, bar, pie or polar chart without putting memory on the line.
In all of its simplicity, Highcharts is also very much compatible with old browsers, so you can pick it if you don’t need to represent data using advanced charting styles.
It can also be installed using npm:
npm install highcharts -- saveTo know more about this library, check out the official website and GitHub page.
Example - Highcharts bubbles with radial gradient fill
RECHARTS
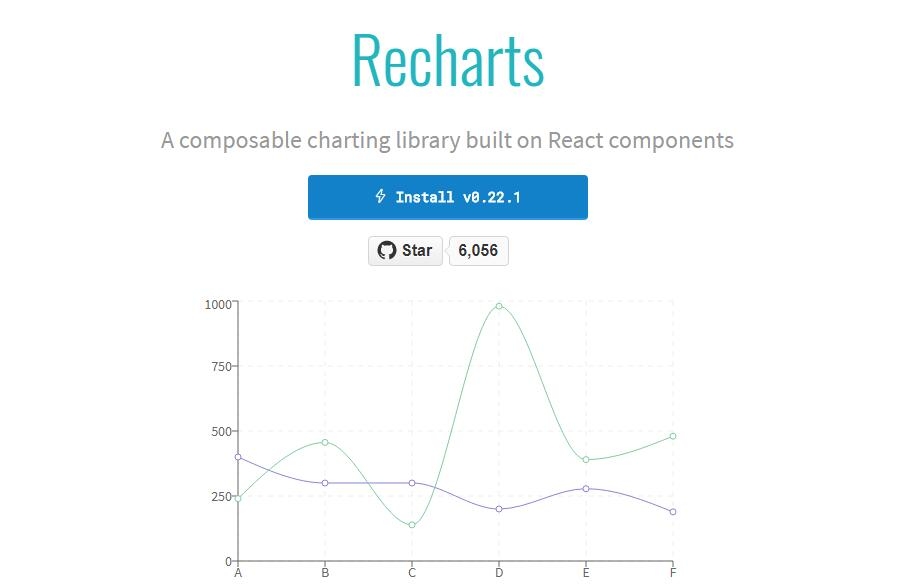 ReCharts is a chart library built with React and based on the D3 charting library.
It is redefined to make thing easy for React lovers, as you can write charts in your React web applications seamlessly.
Recharts is very much lightweight and renders using SVG elements for creating sensational charts.
It can be installed using npm:
npm install rechartsRecharts doesn’t have a lengthy documentation, as it is straight to the point and also easy to get solutions to issues when you face a brick wall.
The official website has much more information on this library as well as the GitHub page.
Example - Custom content treemap
NVD3
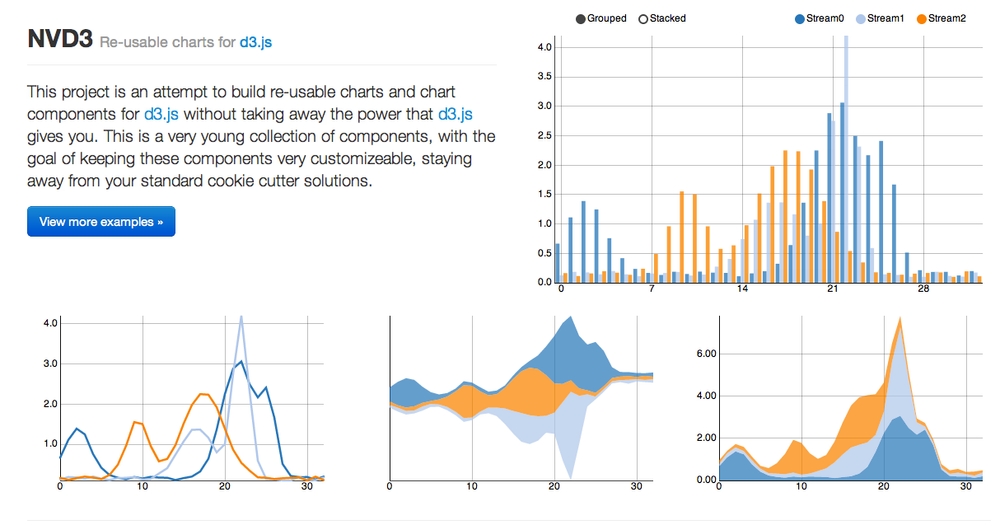 Inspired by Mike Bostock and currently maintained by a team of frontend software engineers at Novus Partners, NVD3 is another quality D3 based JavaScript library. Allowing you to create beautiful reusable charts in your web applications.
It has great features for visualizing data with lovely charts such as the box-plot, sunburst and candlestick charts. If you are looking for tons of functionality in a JavaScript charting library, NVD3 is the one to look out for.
As much as speed could sometimes be an issue with this library, using it with Fastdom installed makes it much more faster.
You can easily learn more about this library from the website and the GitHub page.
Example - Simple line chart
FLOT
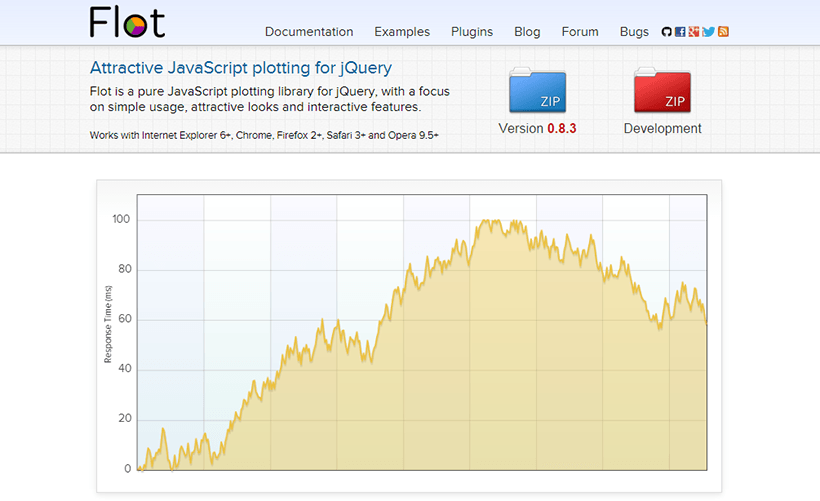 jQuery has become a very important tool for web developers over time. With Flot.js things have just gotten easier.
Flot is one of the oldest charting libraries in the JavaScript world today. However, this by no means reduces its functionality as it supports line charts, pie charts, bar charts, area charts and even stacked charts.
Flot has developed a huge following overtime and also has a wonderful documentation. Therefore, it is easier to find solutions to problems when you come across a brick wall.
It also gives support to older browsers.
With Flot, you don’t necessarily need to install using npm. All you need is to include the JavaScript file in HTML5 after including jQuery.To get more information on Flot simply check out the official website and the GitHub page.
Example - Basic usage
WRAPPING IT UP
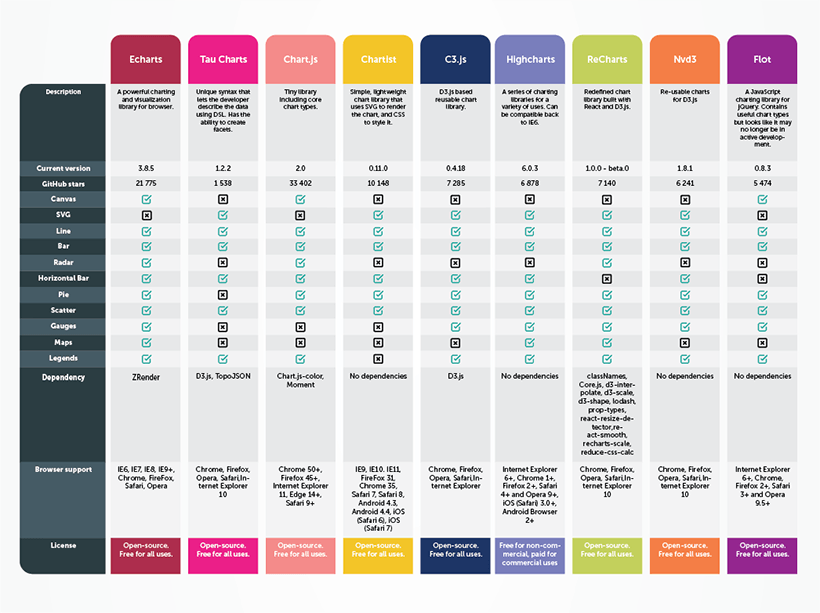
In the end, it would be difficult to choose the best of these libraries, as they are all quality libraries. You could, however, find that some are more difficult to learn, either because of a steep learning curve or due to lack of learning materials on the web. So, it would be best to complement one library with another. There are also lots of other libraries asides the nine discussed in this article, so just in case you don’t find what you want from this great list of nine you can make further research.
Not all of these libraries are free though, so it is important you check out their official websites to see the terms and conditions tied to using these tools. This should however not stop you from visualizing your data in the most beautiful way possible. Go ahead and represent those numbers with charts.
