Data has gradually become a very important aspect tool in the world today.
Data is driving the world, and at this stage when the world is being held to ransom by data and the web, it only makes sense to read information into the lots of data being generated out there.
A language like JavaScript is very important in the manner in which a web page gets to be displayed, and it makes complete sense for it to have a means of displaying data to the client.
Fortunately for the JavaScript evangelists, frontend developers, and data scientists, this article discusses three major JavaScript frameworks for visualizing data to the client without having to switch to a language which have been touted to be more data related such as Python and R.
The three major drawing tools that article talks about include Processing.js, Raphael.js andD3.js
Processing.js
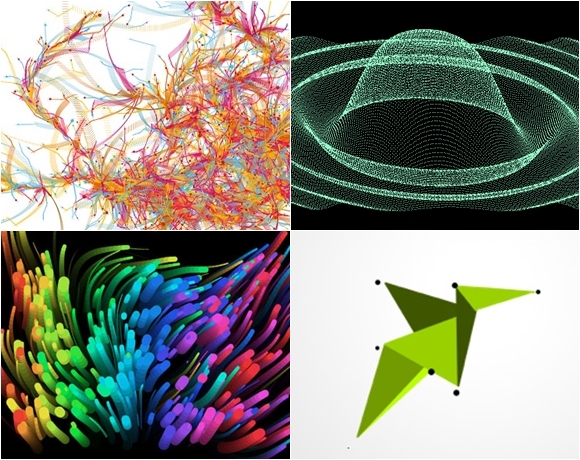
Processing is both a language and programming environment, with a Java like syntax as its native code, originally developed by Ben Fry and Casey Reas in 2001. It was then ported to JavaScript by John Resig to be open sourced in 2008.
Users of Processing call their applications sketches, and Processing.js simply converts the native code into JavaScript so as to render them on the web page.
See the Pen electron-processing by Dash Bouquet (@dashbouquetdevelopment) on CodePen.
It also has a setup() and draw() function, used to initialize the application state and draw on the canvas element respectively.
The process of learning to use the processing.js framework is beyond the scope of this article. However, the online reference can be found here.
It is encouraging to know that:
- It is an efficient and painless way to bring your web pages, which leads to a better understanding of your points by your readers.
- It also gives room for interaction from the user, as it can take input from them; thereby making it a very resourceful tool.
Processing.js can be downloaded here. By the time you get to master or work with it, you can contribute to the project.
As powerful as this tool is, it is said to be the least powerful of the three frameworks to be discussed in today’s article. That takes us to the next framework.
Raphael.js
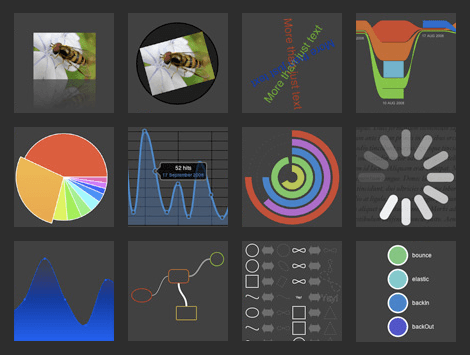
Raphael’s strongest point is said to be its ability to allow for easy drawing. To make use of Raphael, all you need is a browser and text editor. However; that’s not the most exciting part.
Raphael also:
- Allows for coding too, you can write commands for it to draw things in a unique way when a user loads your web page.
- Supports the
- Works on almost all browsers, the old browsers and most likely the ones to come.
- Doesn’t require external plugins to function properly.
- Is mobile device friendly.
Raphael works directly with browser’s built-in graphics language known as Scalable Vector Graphics (SVG).
See the Pen Roundabout-Raphael by Dash Bouquet (@dashbouquetdevelopment) on CodePen.
However, the main reason Raphael is compatible with older browsers is that it works well with a format known as Vector Markup Language (VML).
Unlike Processing.js which had to be ported from Processing and is a Java-based language, Raphael is purely JavaScript; meaning it works seamlessly and naturally with web pages.
Raphael.js is a more popular framework than Processing.js. It also has lots of users in the data visualization community and you would have people to turn to whenever anything goes wrong. It is open source and would definitely be improved upon, there is nothing to fear, Raphael is one for the future. All these most likely give Raphael.js an edge over other data visualization frameworks out there.
One more thing, Raphael has an easy learning curve and can be used almost immediately. That takes us to the next one which is said to be the best framework for visualization but has a steep learning curve.
D3.js
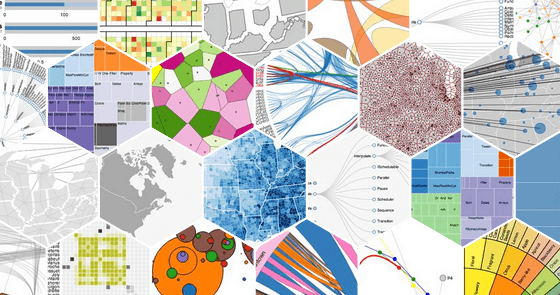
D3 stands for (Data Driven Documents) and as the name implies; is well packaged for data visualization purposes. It translates raw datasets into visualization and works seamlessly with Microsoft Excel. D3 was created by one of the leading evangelists of web data visualization, Mike Bostock. Just like Raphael.js, D3 works with SVG and has the visualization shapes as part of the DOM (Document Object Model). Meaning you can style and design your data, making use of Cascading Style Sheets (CSS).
See the Pen Collision Detection D3.js by Dash Bouquet (@dashbouquetdevelopment) on CodePen.
D3.js is based on HTML, DOM, CSS, SVG and also supports Canvas. D3 has lots of other frameworks built on it that allow for drag and drop. D3 is a great tool to invest in for the long-term, to create your own libraries that you can then use to speed up the creation process. For data visualization purposes, the most important interaction with SVG is to bind data to them, D3 allows for the rewriting of data wrapper around them.
As it stands D3.js is not just better than Raphael.js and Processing.js in many cases, but is also a viable replacement for jQuery and other frameworks. However, D3 is said to have a steep learning curve and is mostly conducive to programmers with experience using JavaScript.
Tools built on D3 include MetricsGraphics, Epoch, Vega, NVD3 and much more. These tools can be used instead of learning the D3 from scratch. To get started with D3 head to the D3 website and download the latest version.
Wrapping it up
Still not sure of what framework to choose?
You see –
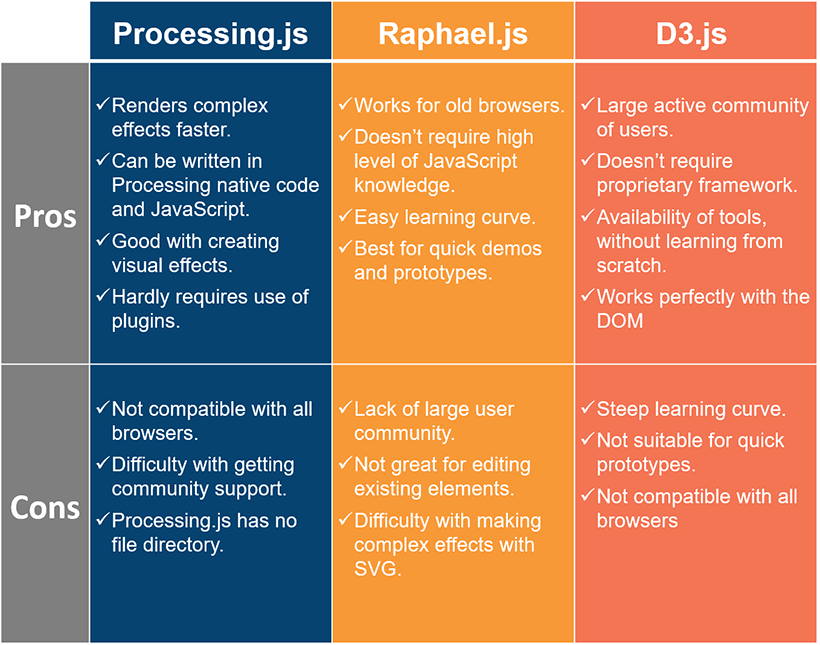
When deciding what framework to use for your data visualizations, you have to know your priorities. Hopefully, the following pros and cons would help you define them:
Share this article with all the programmers, data analysts, scientists and engineers you know. This could change their careers for good. Subscribe to DashBouquet news and stay updated!
